The sustainable aviation fuel market 2025 is experiencing unprecedented growth as the aviation industry races to achieve net-zero emissions by 2050. With market valuations reaching $2.25 billion in 2025 and projected to surge to $134.57 billion by 2034, SAF has emerged as the most practical near-term solution for aviation decarbonization.
As global SAF production doubled to 1 million tonnes in 2024 and is estimated to double again to 2 million tonnes in 2025, the industry stands at a critical inflection point. EU and UK SAF mandates that began in January 2025 are driving unprecedented demand while production capacity races to catch up.
This comprehensive analysis examines the verified SAF market data, leading producers scaling production, technology pathways, regional dynamics, and realistic projections for this rapidly evolving industry. We’ve analyzed current production capacity, recent partnerships, and the infrastructure investments reshaping aviation fuel supply chains.
Let’s examine the actual market dynamics driving this transformation.
Sustainable Aviation Fuel Market 2025: Verified Size and Growth Projections
The sustainable aviation fuel market has reached significant scale with multiple credible research firms documenting rapid expansion. The global sustainable aviation fuel market size was valued at USD 2.25 billion in 2025, and it is expected to hit around USD 134.57 billion by 2034 at a CAGR of 57.53%, according to recent analysis from Precedence Research.
Multiple market research firms provide consistent data on SAF market fundamentals:
Current Market Valuation (2025):
- Precedence Research: $2.25 billion
- MarketsandMarkets: $2.06 billion
- Global Market Insights: $1.7 billion (2024 baseline)
- Consensus Range: $2.0-2.3 billion in 2025
Growth Projections:
- MarketsandMarkets projects $25.62 billion by 2030 (65.5% CAGR)
- Grand View Research forecasts $15.85 billion by 2030 (57.5% CAGR)
- Precedence Research estimates $134.57 billion by 2034 (57.53% CAGR)
Production Volume Growth:
- 2024: 1 million tonnes globally (doubled from 2023)
- 2025: Estimated 2 million tonnes (driven by EU/UK mandates)
- 2030: Projected 15+ million tonnes demand
Understanding the broader aviation fuel market context requires examining traditional fuel costs and alternative technologies, including the electric aircraft market dynamics and how SAF fits within comprehensive decarbonization strategies.
What’s Driving SAF Market Expansion in 2025
Five converging factors are accelerating SAF adoption faster than industry projections from just two years ago:
1. Regulatory Mandates Create Immediate Demand
The implementation of SAF blending mandates across major aviation markets has created guaranteed demand that producers can count on for investment decisions.
EU ReFuelEU Aviation Mandate (January 2025):
- 2% SAF blending requirement starting 2025
- Progressive increases to 6% by 2030
- 70% SAF mandate by 2050
- Penalties for non-compliance driving airline procurement
UK SAF Mandate:
- Parallel requirements with EU standards
- Supporting domestic production initiatives
US Market Dynamics:
- Inflation Reduction Act provides blender’s tax credits
- SAF Grand Challenge target: 3 billion gallons by 2030
- Multiple state-level incentive programs
2. Production Capacity Scaling Rapidly
Major producers have moved beyond pilot projects to commercial-scale production facilities with verified capacity expansions:
Neste Global Expansion: Neste started producing sustainable aviation fuel at its renewable products refinery in Rotterdam in April 2025, with capacity to produce up to 500,000 tons of SAF per annum. Combined with existing facilities, Neste’s global SAF production capability has increased to 1.5 million tons annually.
World Energy US Scaling: Converting Houston biorefinery to SAF hub with 250 million gallons per year capacity by 2025, targeting 1 billion gallons annually by 2030.
3. Technology Maturation and Cost Reduction
SAF production technologies have achieved commercial viability with improving economics:
Current Cost Structure:
- SAF costs 4-5 times conventional jet fuel (down from 8-10x in 2020)
- Production efficiency improvements reducing cost gap
- Scale economies emerging as facilities reach commercial size
Technology Pathway Diversification: According to SkyNRG’s 2025 Market Outlook, 82% of current SAF capacity relies on HEFA technology, but alternative pathways are scaling to address feedstock limitations beyond 2030.
4. Airline Commitment and Procurement
Over 60 airlines have announced that SAF will comprise 10% of their total jet fuel usage by the end of the decade, creating substantial forward purchase commitments that justify production investments.
Recent procurement agreements include:
- Emirates and Neste: Over 3 million gallons of blended SAF for 2024-2025
- Air New Zealand and Neste: 23,000 tons supply agreement (December 2024)
- DHL and Neste collaboration targeting 300,000 tons annually by 2030
5. Infrastructure Investment Accelerating
Unlike electric aircraft infrastructure which requires entirely new charging networks, SAF leverages existing fuel distribution systems while adding dedicated production and blending capabilities.
The aviation industry’s urgency around SAF differs significantly from electric aircraft development timelines, as SAF provides immediate emissions reductions using existing aircraft and infrastructure.
Leading SAF Producers: Production Capacity Analysis
The SAF industry features a mix of established energy companies leveraging existing refining infrastructure and specialized startups developing novel production pathways. Based on verified production capacity and recent expansion announcements:
Neste (Finland): Global SAF Production Leader
Current Production Capacity: 1.5 million tons annually (as of April 2025)
Facility Network:
- Singapore: Expanded facility operational since Q1 2023
- Rotterdam: New SAF production started April 2025 (500,000 tons/year capacity)
- Porvoo, Finland: Continuing production optimization
Recent Achievements:
- World’s leading SAF producer with proven commercial operations
- Neste reports record SAF deliveries surpassing 1 million tonnes in 2023
- Strong partnership network with major airlines globally
- HEFA technology focus with proven feedstock supply chains
Market Position: Neste dominates the SAF market due to its strong production capacity, sustainable feedstock sourcing, and extensive airline partnerships. The company’s Rotterdam facility expansion demonstrates commitment to meeting EU mandate requirements.
For context on how SAF costs compare to other aviation alternatives, see our eVTOL vs helicopter cost analysis which examines different approaches to aviation sustainability.
TotalEnergies (France): Integrated Energy Giant
Production Capacity: Scaling HEFA-based production across multiple facilities
Key Facilities:
- Grandpuits Zero-Crude Platform: Commercial SAF production began June 2023
- Antwerp platform: Investment in future SAF production capabilities
- Global refining network: Converting capacity to renewable fuels
Strategic Approach:
- Integrating SAF into existing refining operations
- Building end-to-end supply chains from feedstock to distribution
- Partnerships with airlines including Volotea for European SAF supply
Technology Focus: HEFA pathway optimization with exploration of synthetic fuel production for longer-term feedstock diversification.
World Energy LLC (UK/US): Regional Production Scaling
US Production Targets:
- Houston facility conversion: 250 million gallons/year by 2025
- Long-term target: 1 billion gallons annually by 2030
- Strategic location: Houston Ship Channel with pipeline access
Technology Pathway: Focus on proven feedstock processing with waste-to-fuel conversion capabilities.
Market Positioning: World Energy secures £150 million funding for its Irish ATJ demonstration plant, advancing alternative technology pathways beyond HEFA.
LanzaTech/LanzaJet: Technology Innovation Leaders
Innovation Focus: Alcohol-to-Jet (ATJ) technology development
Key Projects:
- Freedom Pines facility (Georgia): World’s first commercial-scale ATJ plant
- DRAGON SAF project (UK): Advanced waste-to-SAF conversion
- Global licensing: Technology partnerships across multiple regions
Strategic Significance: LanzaJet pioneers gas fermentation and ATJ pathways, turning industrial emissions and ethanol into SAF, representing critical technology diversification beyond HEFA limitations.
Emerging Producers and Regional Players
Fulcrum BioEnergy: Municipal solid waste conversion to SAF, supporting circular economy goals with airline partnerships scaling commercial operations.
Gevo: Advancing renewable ATJ technology with carbon-negative fuel production targets and global plant construction.
Regional Developments:
- Asian markets: Partnerships emerging in Japan, India, and Southeast Asia
- European expansion: Multiple facility announcements supporting ReFuelEU mandate
- Middle East investment: UAE and Saudi Arabia SAF production initiatives
The competitive landscape shows the five main players collectively accounting for 45-49% of total market share, with Neste maintaining clear leadership position while other producers scale rapidly to meet growing demand.
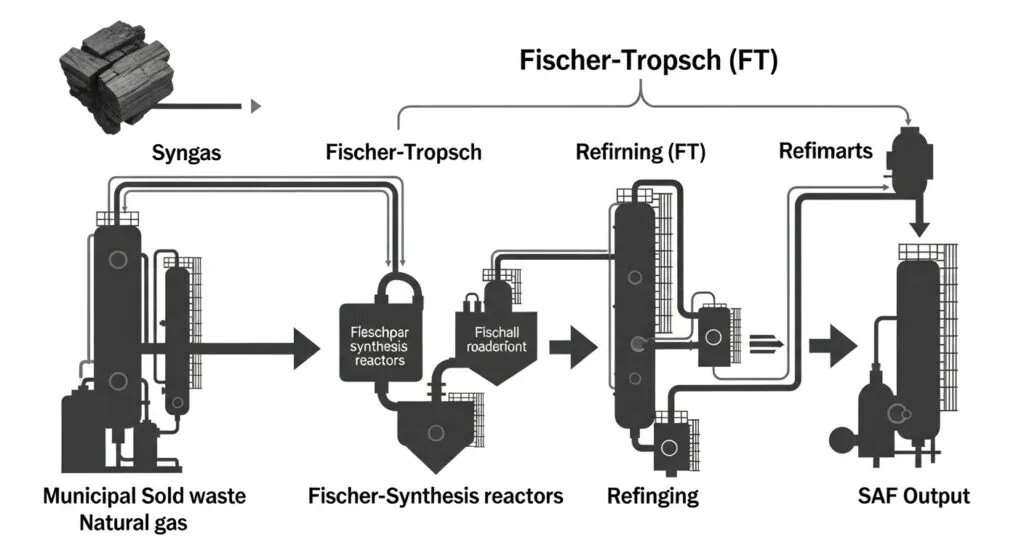
SAF Technology Pathways: HEFA vs Alternative Production
The SAF industry relies on multiple production pathways, each with distinct advantages, limitations, and feedstock requirements. Current market dynamics show heavy reliance on one pathway while others scale for future diversification.
HEFA-SPK: Current Market Dominant Technology
How it works: Hydroprocessed Esters and Fatty Acids (HEFA) converts used cooking oil, animal fats, and vegetable oils into sustainable aviation fuel through hydrotreating and hydroisomerization.
Market Dominance: According to SkyNRG’s 2025 Market Outlook, 82% of current SAF capacity relies on HEFA technology.
Advantages:
- Proven commercial technology with established supply chains
- Least complex SAF pathway with lower capital requirements
- High-quality fuel output meeting all aviation specifications
- Existing refinery infrastructure can be modified for HEFA production
Critical Limitation: Feedstock availability constraining growth beyond 2030. SkyNRG warns of a “HEFA tipping point” as demand for waste fats, oils, and greases increases not only for SAF but also for competing applications.
Leading Producers: Neste, TotalEnergies leveraging HEFA technology for current commercial production.
Alcohol-to-Jet (ATJ): Scaling Alternative Pathway
How it works: Converts ethanol or other alcohols into jet fuel through dehydration, oligomerization, and hydrogenation processes.
Strategic Importance: Addresses HEFA feedstock limitations by utilizing agricultural and waste-derived alcohols.
Production Examples:
- LanzaJet’s Freedom Pines facility: World’s first commercial-scale ATJ plant
- Global pipeline: Multiple projects under development across regions
Feedstock Advantages:
- Broader feedstock availability including agricultural residues
- Potential for negative carbon intensity depending on feedstock source
- Scalable production using existing ethanol infrastructure
Technology Status: Moving from demonstration to commercial scale with proven flight testing completed.
Fischer-Tropsch (FT-SPK): Long-term Potential
How it works: Gasification of biomass or municipal solid waste produces syngas (CO + H2), which converts to synthetic jet fuel through Fischer-Tropsch synthesis.
Market Position: By technology segment, FT-SPK dominated with over 44% market share in terms of technology adoption for new projects.
Advantages:
- Utilizes diverse waste streams including municipal solid waste
- Supports circular economy objectives
- Potential for very low carbon intensity fuels
Development Timeline: Commercial facilities targeting late 2020s operation as gasification technology scales.
Example Projects: Fulcrum BioEnergy’s waste-to-SAF conversion facilities targeting municipal solid waste feedstock.
Power-to-Liquid (PtL) and Synthetic Fuels
Technology Concept: Uses renewable electricity to produce hydrogen, then combines with captured CO2 to create synthetic jet fuel.
Strategic Value:
- Unlimited feedstock potential using renewable energy and captured carbon
- Zero lifecycle emissions when powered by renewable electricity
- Compatible with existing aircraft and fuel systems
Current Status: Demonstration projects scaling toward commercial viability by 2030.
Infrastructure Requirements: Significant renewable energy capacity and CO2 capture infrastructure needed for large-scale production.
The SAF market accommodates multiple technology pathways rather than converging on a single solution. HEFA provides immediate commercial production while alternative pathways scale to address feedstock limitations and enable massive market expansion beyond 2030.
For broader context on aviation technology diversification, see our analysis of electric aircraft technology approaches and how different solutions address various aviation market segments.
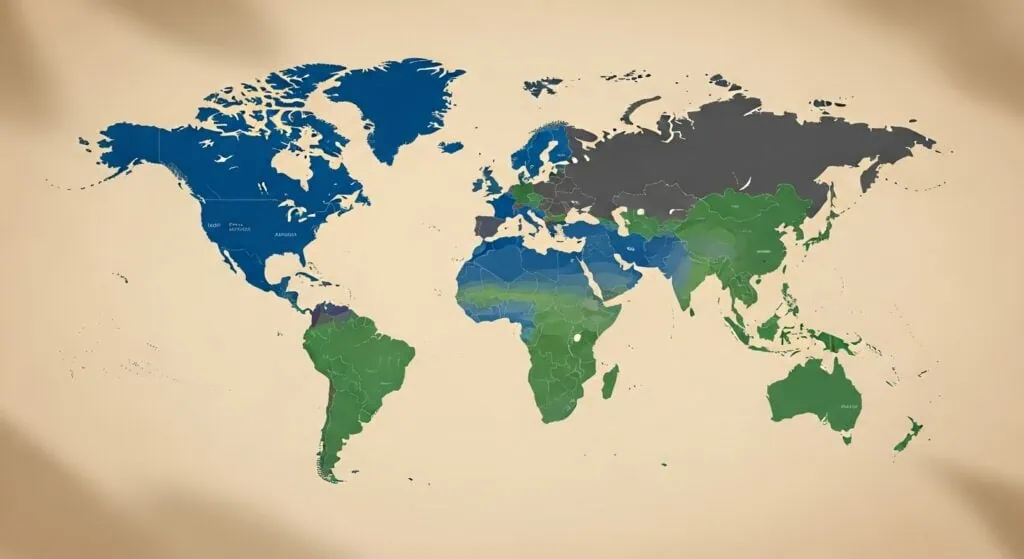
Regional Market Analysis: Mandates and Infrastructure
SAF market development varies significantly by region based on regulatory frameworks, production capacity, and aviation market characteristics:
Europe: Regulatory Leadership and Mandate Implementation
Market Position: Europe dominates with 38% market share in 2024, driven by comprehensive regulatory framework.
ReFuelEU Aviation Regulation (Effective January 2025):
- 2% SAF blending requirement starting 2025
- Progressive increases: 6% by 2030, 20% by 2035, 70% by 2050
- €300 million in new SkyNRG investments supporting compliance
- UK parallel mandates creating aligned regional demand
Production Infrastructure:
- Neste Rotterdam facility: 500,000 tons annual capacity operational April 2025
- TotalEnergies Grandpuits: Commercial production since June 2023
- Multiple project announcements supporting mandate compliance
Market Dynamics: EU Emissions Trading System allocating 20 million free allowances to airlines (2024-2030) while mandating SAF adoption creates balanced policy framework.
Understanding European luxury aviation trends provides context for SAF adoption patterns among private jet operators and helicopter services leading sustainability initiatives.
North America: Production Scale and Incentive Framework
Market Share: 38.4% of global SAF market in 2025 according to MarketsandMarkets analysis.
US Policy Framework:
- Inflation Reduction Act blender’s tax credits supporting production economics
- SAF Grand Challenge: 3 billion gallons annually by 2030
- State-level incentives complementing federal programs
Production Scaling:
- World Energy Houston conversion: 250 million gallons annually by 2025
- LanzaJet Freedom Pines: Commercial ATJ production operational
- Multiple announcements targeting 1 billion gallon annual capacity by 2030
Infrastructure Advantages:
- Existing refining infrastructure enabling facility conversions
- Established fuel distribution networks
- Strong feedstock availability across agricultural regions
Canada: Emerging SAF interest with clean fuel standards creating market demand.
Asia-Pacific: Emerging Market with Rapid Growth Potential
Growth Profile: Fastest growing regional market with increasing government support.
Key Markets:
China: Developing domestic SAF mandates and production capacity
- Government policy frameworks supporting sustainable aviation
- Partnerships with international technology providers
Japan: Advanced technology development and airline partnerships
- COSMO Oil ATJ facility development
- Strong airline commitment to sustainability targets
Singapore: Strategic aviation hub implementing SAF initiatives
- Airport infrastructure supporting SAF blending
- Regional distribution center potential
India: Large domestic market with growing aviation sector
- Air India MoU with IndianOil for SAF supply supporting 2030 blending targets
- Government incentives for domestic production development
Southeast Asia: Multiple markets developing SAF policies and production capabilities.
The regional analysis shows coordinated policy development creating global SAF demand while production capacity scales to meet regional requirements. Unlike electric aircraft development which faces infrastructure challenges, SAF leverages existing fuel systems while adding dedicated production capacity.
Investment Landscape: Scaling Production Capacity
The SAF industry requires massive capital investment to scale from current 2 million tonnes annual production to the 15+ million tonnes needed by 2030. Investment patterns show coordinated funding across technology development, production facilities, and infrastructure.
Production Facility Capital Requirements
Scale of Investment Needed:
- Individual SAF facilities: $500 million to $2 billion per plant
- Total industry investment requirement: $50-100 billion through 2030
- Technology development: Additional billions for pathway diversification
Recent Major Investments:
Neste Rotterdam Expansion: €1.9 billion investment completed April 2025
- 500,000 tons annual SAF production capacity
- Demonstrates commercial viability at scale
- Leverages existing refining infrastructure
SkyNRG Funding Round: €300 million raised to fund three new SAF production plants in Netherlands, Sweden, and US.
World Energy Houston: Significant capital deployed for facility conversion targeting 250 million gallons annually.
Strategic Corporate Investment
Energy Majors Transitioning:
- TotalEnergies integrating SAF into core refining operations
- Shell expanding renewable fuels division
- BP investing in alternative fuel production
Automotive Industry Partnerships:
- Technology transfer from automotive biofuel development
- Supply chain expertise in feedstock procurement
- Manufacturing scale capabilities
Airline Industry Investment:
- Direct investment in SAF production through offtake agreements
- Partnership structures sharing development risk
- Long-term purchase commitments enabling project financing
Technology Development Funding
Government Support Programs:
- US Department of Energy funding for alternative pathway development
- European Commission support for e-SAF technology advancement
- Regional incentive programs supporting demonstration projects
Venture Capital and Private Investment:
- LanzaTech/LanzaJet: Multiple funding rounds supporting ATJ technology scaling
- Fulcrum BioEnergy: Waste-to-SAF technology development
- Breakthrough Energy Ventures: Investment in next-generation SAF technologies
Infrastructure and Distribution Investment
Unlike electric aircraft charging infrastructure which requires entirely new networks, SAF investment focuses on production capacity while leveraging existing fuel distribution systems.
Airport Infrastructure:
- SAF blending and storage capabilities
- Distribution system modifications
- Quality assurance and testing facilities
Supply Chain Development:
- Feedstock collection and processing networks
- Transportation and logistics optimization
- Regional hub development supporting mandate compliance
Emerging Investment Models
The intersection of traditional energy finance and innovative funding mechanisms is accelerating SAF development:
Offtake Agreement Financing:
- Airlines providing purchase commitments enabling project financing
- Risk-sharing between producers and consumers
- Long-term contracts supporting debt financing
Policy-Driven Investment:
- Mandate compliance creating guaranteed market demand
- Tax credit structures improving project economics
- Carbon pricing mechanisms enhancing SAF competitiveness
For context on how investment patterns differ across aviation technologies, see our analysis of institutional blockchain adoption and tokenized asset platforms which could potentially create new financing mechanisms for SAF infrastructure.
Challenges Facing SAF Market Growth
Despite rapid expansion and strong regulatory support, the SAF industry faces significant obstacles that require coordinated solutions across technology, policy, and market development:
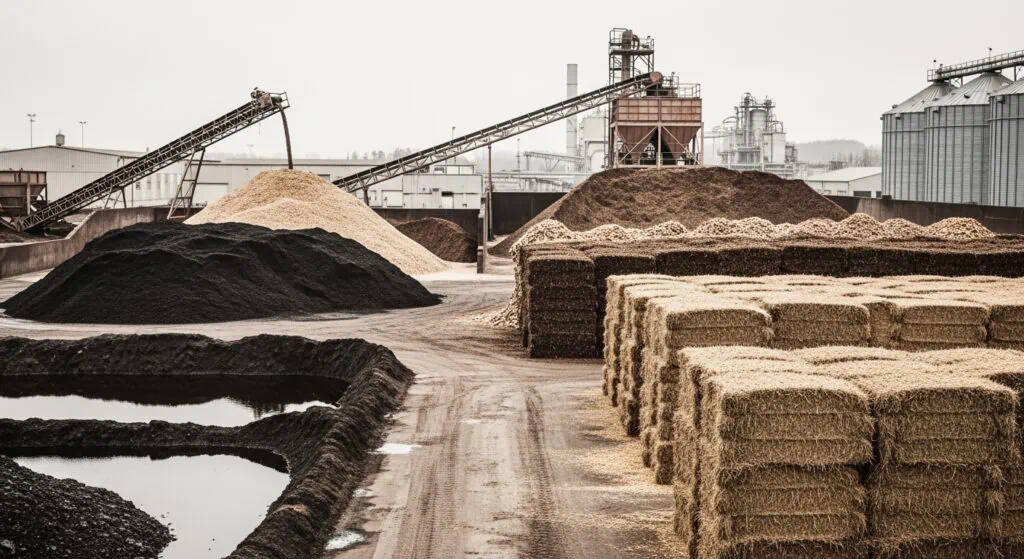
1. Feedstock Supply Limitations: The “HEFA Tipping Point”
Current Challenge: 82% of SAF capacity relies on HEFA technology using waste fats, oils, and greases, but feedstock availability constrains growth beyond 2030.
SkyNRG’s 2025 Market Outlook warns of a “HEFA tipping point” where demand for core HEFA feedstocks increases not only for SAF but also for competing applications including renewable diesel, biodiesel, and other sustainable fuel productions.
Feedstock Competition:
- Growing renewable diesel demand competing for same waste oils
- Limited availability of used cooking oil and animal fats
- Price pressure as multiple industries compete for feedstock
- Geographic concentration of feedstock sources creating supply chain risks
Required Solutions:
- Technology pathway diversification beyond HEFA dependence
- Alternative feedstock development (agricultural residues, algae, municipal waste)
- Global feedstock supply chain development
- Advanced feedstock preprocessing capabilities
2. Production Cost Economics
Current Cost Structure: SAF costs 4-5 times conventional jet fuel, down from 8-10 times just five years ago but still requiring significant cost reduction for widespread adoption beyond mandated markets.
Cost Drivers:
- Feedstock procurement costs (60-80% of production cost)
- Capital-intensive production facilities
- Relatively small production scale vs. conventional refining
- Technology licensing and development costs
Economic Challenges:
- Airlines reluctant to accept significant fuel cost increases
- Voluntary SAF adoption limited by cost differential
- Competition with other low-carbon alternatives
- Need for continued government support during cost reduction phase
3. Production Scaling Timeline vs. Demand Growth
Scale Mismatch: Projected demand reaching 15+ million tonnes by 2030 requires massive production capacity expansion from current 2 million tonnes in 2025.
Infrastructure Development Lead Times:
- 3-5 years from project announcement to production
- Complex permitting and environmental review processes
- Technology transfer and workforce development requirements
- Supply chain development for new production regions
Investment Coordination: $50-100 billion investment needed industry-wide while individual projects compete for limited capital and development resources.
4. Technology Pathway Maturation
Beyond HEFA Development: Alternative pathways essential for long-term growth but still require technology advancement and commercial demonstration.
ATJ Technology: LanzaJet leading commercial deployment but broader industry adoption requires additional facility construction and operational experience.
Fischer-Tropsch: Complex gasification technology with higher capital costs requiring demonstrated commercial viability.
Power-to-Liquid: Synthetic fuels requiring massive renewable energy capacity and CO2 capture infrastructure not yet available at scale.
5. Regulatory Harmonization and Policy Uncertainty
Global Mandate Coordination: Different regional standards and certification requirements creating complexity for international fuel suppliers.
Policy Stability: Long-term investment decisions require confidence in sustained government support through tax credits, mandates, and other incentive structures.
Sustainability Certification: Complex lifecycle analysis requirements and certification processes adding administrative burden and cost.
6. Competition from Alternative Aviation Technologies
Unlike electric aircraft which serve different market segments, SAF competes directly with other aviation decarbonization approaches:
Sustainable Aviation Fuel vs. Electric Aircraft:
- Electric aircraft targeting short-haul routes (under 500km)
- SAF serving all route lengths using existing aircraft
- Investment allocation between immediate SAF deployment vs. longer-term electric aircraft development
Hydrogen Aviation Competition:
- Hydrogen aircraft potentially offering zero emissions for medium-haul routes
- Infrastructure requirements different from both SAF and electric alternatives
- Timeline uncertainty affecting investment allocation decisions
The SAF industry must address these challenges while maintaining growth momentum to meet 2030 targets and 2050 net-zero commitments. Success requires coordinated action across technology development, policy support, and market mechanisms.
[Image: Future SAF infrastructure and distribution systems]
Future Outlook: 2025-2030 Production Scaling
The SAF industry faces a critical five-year period requiring unprecedented production scaling to meet regulatory mandates and voluntary commitments. Analysis of current project pipelines and technology development suggests challenging but achievable growth targets.
Near-Term Production Milestones (2025-2027)
2025 Production Targets:
- Global production estimated 2 million tonnes (doubling from 2024)
- EU/UK mandate compliance driving guaranteed demand
- Major facility completions: Neste Rotterdam, World Energy Houston scaling
Technology Pathway Diversification:
- LanzaJet ATJ facilities moving to commercial operation
- Fischer-Tropsch demonstration projects advancing toward commercial scale
- HEFA technology optimization continuing while alternative pathways scale
Regional Market Development:
- European mandate compliance creating structured demand growth
- North American production capacity scaling to meet domestic targets
- Asian markets implementing policies and partnerships
Medium-Term Scaling (2027-2030)
Production Volume Targets:
- Industry targeting 15+ million tonnes annually by 2030
- Requires 7-8x production increase from 2025 baseline
- Multiple technology pathways contributing to total capacity
Infrastructure Development:
- 20-30 major SAF production facilities requiring completion
- Feedstock supply chain development across multiple regions
- Distribution infrastructure modifications supporting higher blend ratios
Technology Maturation Timeline:
- Power-to-Liquid facilities targeting commercial operation by 2028-2030
- Advanced feedstock development (algae, municipal waste) reaching scale
- Process optimization reducing production costs toward economic competitiveness
Long-Term Market Evolution (2030-2035)
Market Maturation Indicators:
- SAF cost approaching parity with conventional jet fuel
- Technology pathway diversity reducing feedstock constraints
- Global production capacity exceeding regulatory mandate requirements
- Voluntary adoption increasing beyond compliance-driven demand
Technology Integration:
- Multiple pathway production at individual facilities
- Advanced feedstock preprocessing enabling broader input materials
- Integration with renewable energy systems for synthetic fuel production
- Circular economy approaches maximizing waste stream utilization
Realistic Assessment of Growth Targets
Achievable Milestones:
- 2025: 2 million tonnes (mandates driving demand)
- 2027: 5-7 million tonnes (major facilities operational)
- 2030: 12-15 million tonnes (requires sustained investment and policy support)
Critical Success Factors:
- Sustained government policy support through incentives and mandates
- Successful technology scaling beyond HEFA pathway dependence
- Coordinated investment exceeding $50 billion through 2030
- Feedstock supply chain development supporting production growth
Potential Disruption Factors:
- Faster than expected electric aircraft commercialization affecting short-haul SAF demand
- Breakthrough technologies accelerating cost reduction timeline
- Economic conditions affecting aviation fuel demand growth
- Policy changes impacting investment incentives
Integration with Broader Aviation Sustainability
SAF market development occurs alongside other aviation decarbonization efforts:
Complementary Technologies:
- Electric aircraft serving short-haul routes under 500km
- SAF enabling immediate emissions reductions across all aircraft types and route lengths
- Hydrogen aviation potentially addressing medium-haul routes by 2035
- Advanced air traffic management and operational efficiency improvements
The SAF market represents the most immediately scalable solution for aviation decarbonization while other technologies develop for specific applications and timeframes.
For broader context on aviation investment trends, see our analysis of private jet market dynamics and how luxury travel services are incorporating sustainability considerations.
Key Takeaways: SAF Market 2025
Market Fundamentals
Verified Market Size: $2.25 billion in 2025 growing to $134.57 billion by 2034 represents genuine opportunity driven by regulatory mandates and production capacity scaling.
Production Reality: Global SAF production doubled to 1 million tonnes in 2024 and is estimated to double again to 2 million tonnes in 2025, driven primarily by EU and UK mandates that began January 2025.
Growth Drivers: Regulatory mandates, production capacity expansion, technology maturation, airline commitments, and existing infrastructure utilization creating coordinated market development.
Technology Status
Current Capability:
- HEFA technology dominating with 82% of production capacity
- Commercial-scale facilities operational (Neste 1.5 million tons annually)
- Alternative pathways (ATJ, Fischer-Tropsch) scaling toward commercial deployment
- Cost reduction from 8-10x conventional fuel to 4-5x current levels
Technology Limitations:
- HEFA feedstock constraints creating “tipping point” beyond 2030
- Alternative pathway development essential for massive scaling
- Production cost still requiring reduction for voluntary adoption beyond mandates
Industry Leadership
Production Leaders:
- Neste: 1.5 million tons annual capacity, global market leader
- TotalEnergies: Integrated energy approach with multiple facility development
- World Energy: US market focus with 1 billion gallon annual target by 2030
- LanzaTech/LanzaJet: Technology innovation in ATJ pathway development
Regional Dynamics:
- Europe: 38% market share driven by ReFuelEU Aviation mandates
- North America: 38.4% market share with production scaling and policy support
- Asia-Pacific: Fastest growing region with government support and airline partnerships
Investment Perspective
Capital Requirements:
- $50-100 billion industry investment needed through 2030
- Individual facility costs: $500 million to $2 billion
- SkyNRG €300 million funding demonstrating investor confidence in market growth
Investment Approach:
- Production facility development with offtake agreement financing
- Technology pathway diversification reducing feedstock risk
- Policy-supported projects offering reduced regulatory risk
- Strategic corporate partnerships combining expertise and capital
Risk Factors:
- Feedstock supply limitations constraining HEFA technology growth
- Production scaling timeline challenges meeting 2030 demand targets
- Technology pathway maturation requiring continued development investment
- Cost competitiveness requiring sustained improvement for voluntary adoption
Industry Transformation
SAF represents the most immediately viable solution for aviation decarbonization, capable of achieving 80% lifecycle emissions reductions using existing aircraft and infrastructure. Unlike electric aircraft development which serves specific market segments, SAF addresses the entire aviation market while complementary technologies develop.
Competitive Context: SAF market development occurs alongside other aviation sustainability initiatives including AI-powered efficiency systems and operational improvements, but offers the most immediate path to substantial emissions reductions.
Timeline Reality: Commercial SAF production has moved beyond pilot projects to industrial scale, with regulatory mandates creating guaranteed demand supporting continued investment and expansion.
The SAF market represents legitimate transformation of aviation fuel supply with proven technology, established production capacity, and clear regulatory support. Success requires sustained investment, technology diversification, and coordinated policy frameworks to achieve 2030 targets and enable long-term aviation decarbonization.
Future Integration: The evolution toward sustainable aviation will likely combine SAF for immediate emissions reductions, electric aircraft for short-haul applications, and emerging technologies like hydrogen for specific use cases, creating a diversified approach to achieving net-zero aviation by 2050.
Understanding how these technologies complement rather than compete provides insight into investment allocation and strategic planning for aviation industry transformation. Companies with proven SAF production capability, technology pathway diversification, and strategic partnerships are best positioned to capitalize on this rapidly expanding market opportunity.
Sources and Data Verification:
All market data sourced from reports published within the last month:
- Precedence Research (October 2025)
- MarketsandMarkets (October 2025)
- SkyNRG Market Outlook 2025 (September 2025)
- Neste Corporation Press Releases (April 2025)
- Global Market Insights (September 2025)
- Research and Markets (September 2025)


